Primavera P6 is the most advanced tool for scheduling the projects however it lacks an important feature of linear scheduling, which is well applied in projects that have repetitive activities such as pipeline construction.
This feature is covered by ScheduleReader, which is a tool to review Primavera P6 files without having an expensive P6 license.
Existing Primavera schedule can be modified with the introduction of some UDF (user defined fields) to generate an easy and convenient yet detailed and effective time-location diagram without purchasing any other special tool for this.
The Pipeline Construction Project
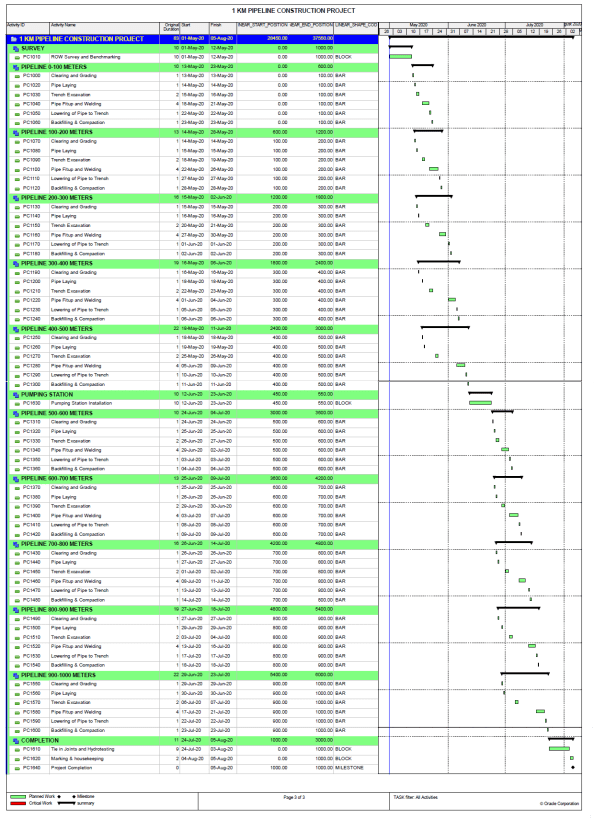
In order to show how to view time-distance diagram, we have a 1KM pipeline project as example.
Usually, users share the project plans in .pdf file format, which is not the most convenient way to view project data.
Our pipeline construction project is printed on a 3-page document, and the Gantt chart looks like follows:
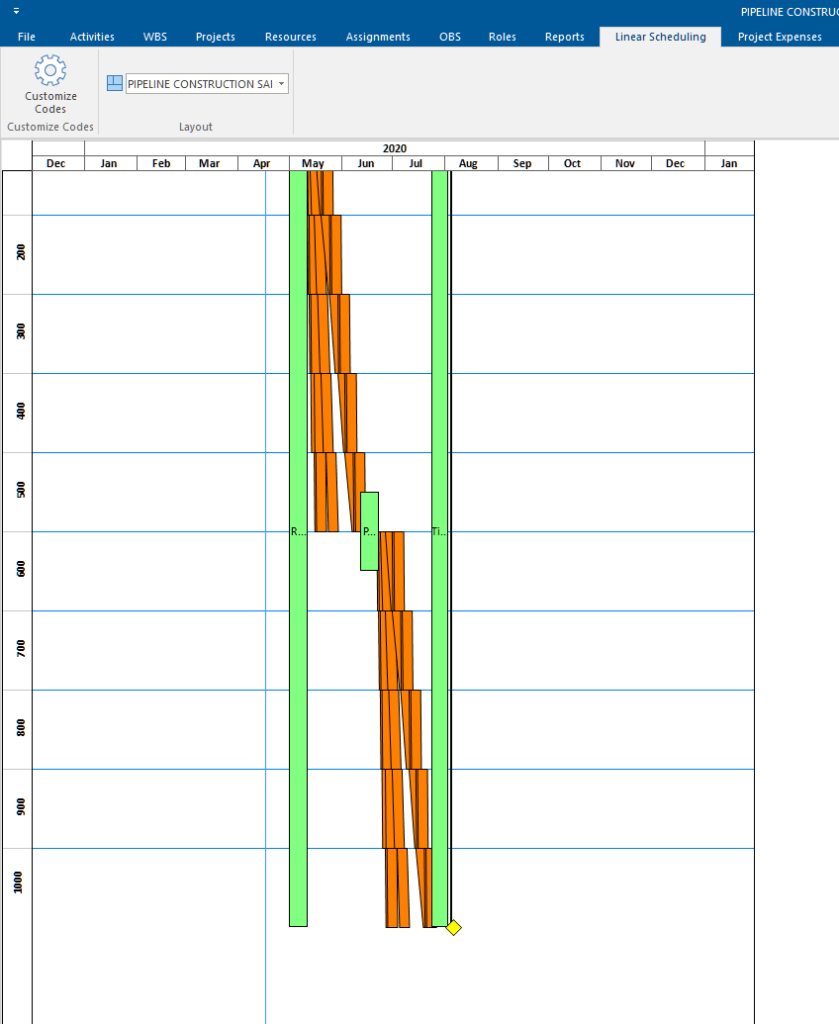
You can simplify above Pipeline project on a 1-page time-distance diagram in ScheduleReader software.
The basic steps to view linear schedules with Primavera and ScheduleReader are outlined below.
Creating UDFs in P6
It’s easy to view linear schedules in ScheduleReader software.
However, there are some necessary thing to do in Primavera P6 before view the linear schedule.
To do that, the user need to create three user-defined fields (UDF) in P6:
- Two fields for starting and ending point of the activity (data type: Number);
- One field for activity shape (data type: Text).
Here are the steps to perform above activities in Primavera P6:
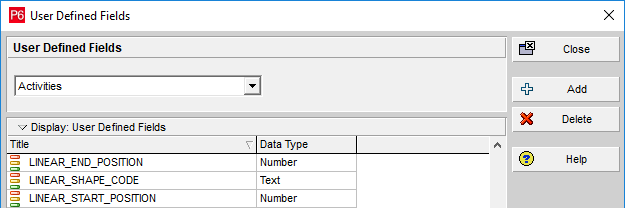
1. Select the “User Defined Fields” from the “Enterprise” menu.
2. Select the “Activity” option from the drop-down list in the “User Defined Fields” dialog and click on the “Add” button.
3. Create the first user defined field that will represent the starting point for the activity by clicking on the “Add” button.
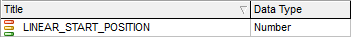
4. In the title field enter “LINEAR_START_POSITION” and select “Number” for Data Type.
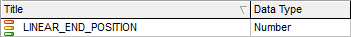
5. Create the second user defined field that will represent the ending point for the activity by clicking on the “Add” button. In the title field enter “LINEAR_END_POSITION”. Select “Number” for Data Type.
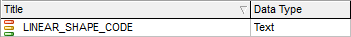
6. Create one user defined field with title “LINEAR_SHAPE_CODE” and select “Text” for Data type.
7. After creating the mentioned fields, the “User Defined Fields” dialog will look like the image below.
It’s important to insert the UDF names as in the example:
“LINEAR_START_POSITION”, “LINEAR_END_POSITION” and “LINEAR_SHAPE_CODE”.
Otherwise, the software will inform you that the required fields for drawing time-location diagram are missing from the project.
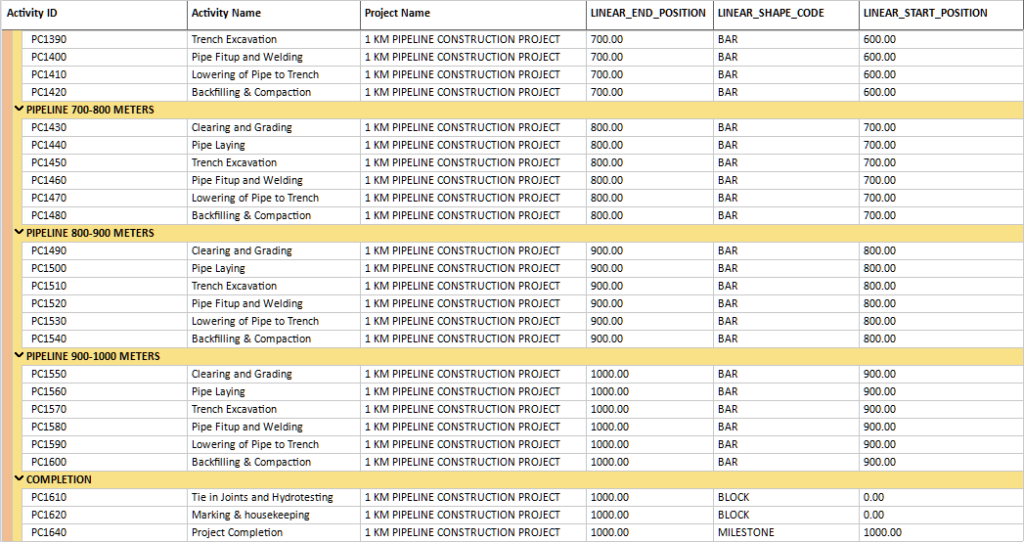
Once the UDFs are created, insert them in the Activity table and populate the values for Start Point”, “End Point” and “Shape”.
Here is an example of a properly populated UDFs:
View the Time-Location chart
Now, once you have the 3 UDF in the .xer file, open ScheduleReader and load file.
When the project file is loaded, ScheduleReader check whether the mentioned user defined fields (LINEAR_START_POSITION, LINEAR_END_POSITION and LINEAR_SHAPE_CODE) exists in the .xer file.
If these fields are not part of the project plan, the ScheduleReader will pop-up message when time-location diagram is selected.
If UDFs are good, then click on the Linear Scheduling view tab in the menu to view the linear schedule of the project.
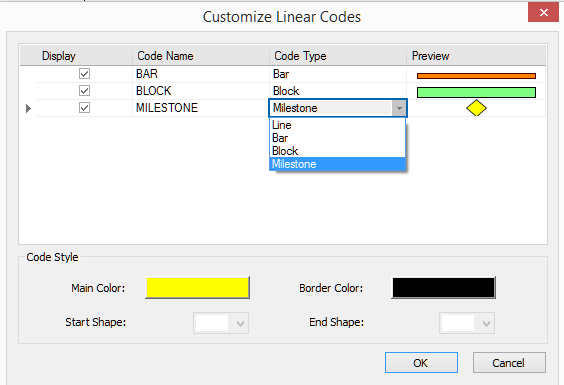
Here you can also customize the chart colors and shapes.
Chart’s customization can be done using the “Customize Codes” option. Using this dialog, use can choose whether come bar will be presented or not, choose the graphical type that will be associated to specific code and the object’s colors as well.
Chart’s customization is performed with the following steps:
1. With the check-boxes in the “Display” column, user decides whether that particular shape will be presented in the view or not;
2. Each field from the “Code Type” column contains drop-down list with the available shapes.
3. Users can change the color of a specific code by using the features in the “Code Style” section. The “Main Color” and the “Border Color” can be changed.
After customization, the view will be changed according the standards, rules and recommendations that are used in each company when linear projects are managed.
After customization, our pipeline project example will look like the image below.

Ljubisha Mladenovski is a skilled Product Analyst, with 15 years’ experience in developing Project Management software. Strong business development professional, skilled in Business Analysis, Project Management applications, and Agile Methodologies.